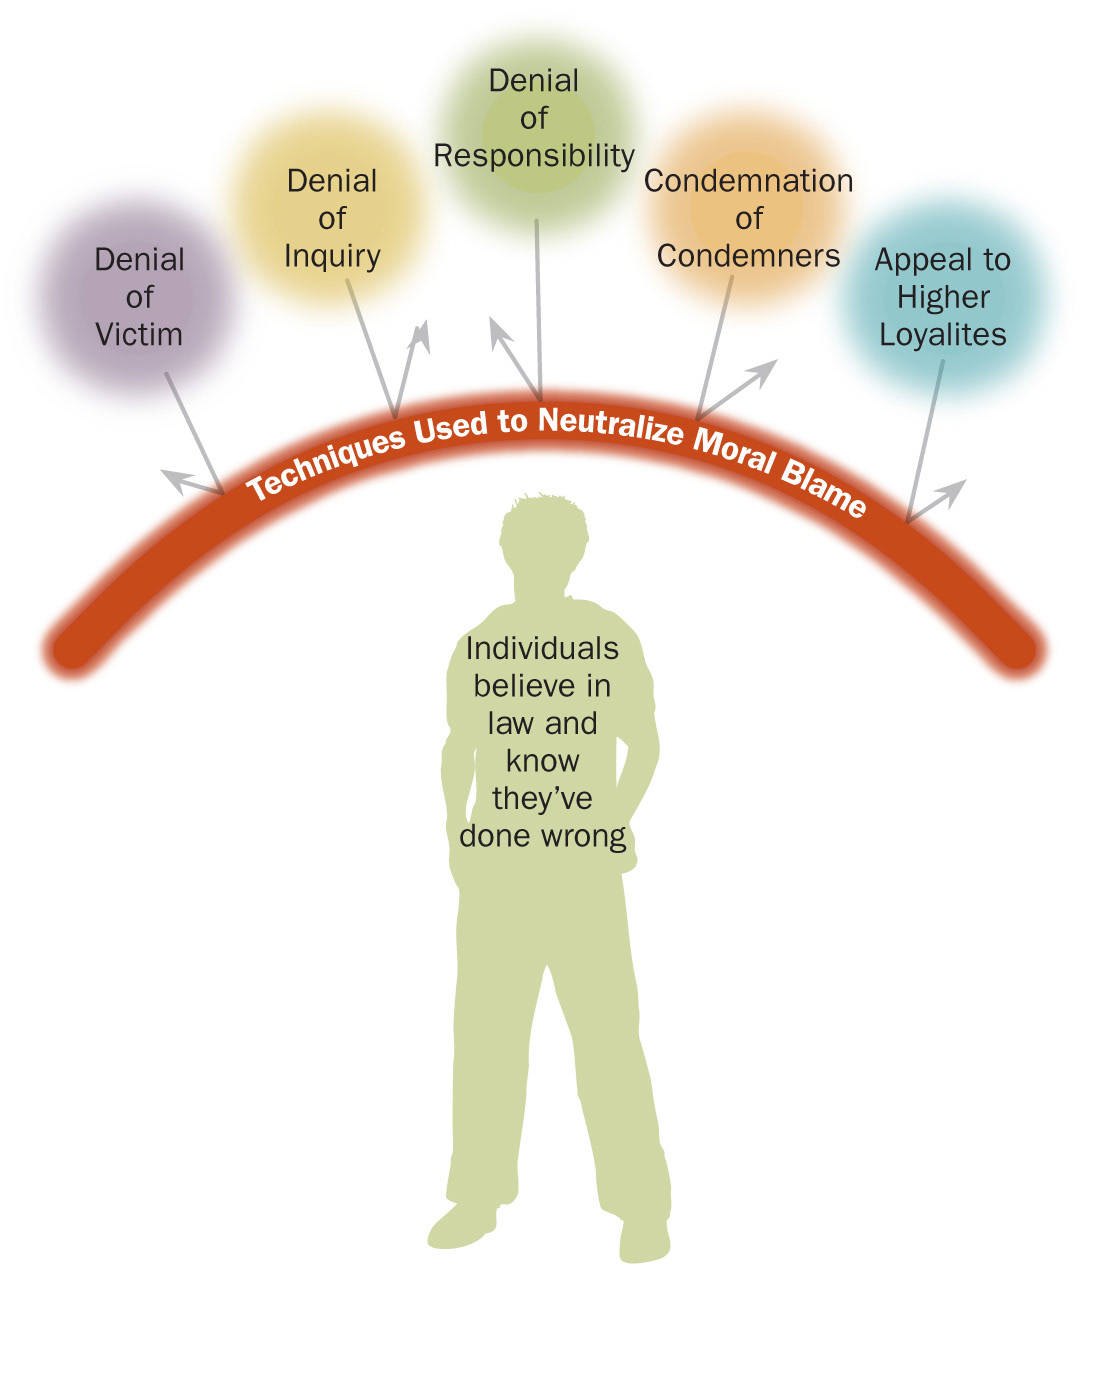
Infographics for a college criminology text


"Iceberg" diagram gives a visual idea of the amount of crime that goes unreported.

Graphic illustrates the range of shrapnel from explosives ranging from a packed semi to a single stick of dynamite. Grim topic, I know. Remember, it's a criminology text!

Rows of dots are a nice break from bar or line graphs and allow readers to get a quick visual idea of quantities.

Map and bar graph are tied together by color and style.


A unified color palette and type design tie together a variety of graphic types.


